Sooner or later every business owner asks the same question: is our marketing actually working? In most small businesses, the honest answer is "we think so". There's a monthly ad bill, an SEO retainer, some social posts and a newsletter. Enquiries come in. Nobody can say which of those things paid for itself.
You don't need an enterprise data team to answer it. Google Analytics 4 is free, and with a few hours of setup it can tell you where your enquiries and sales come from. This guide shows how to measure marketing ROI with GA4: what to track, how to connect it to money, and how to turn it into a dashboard you'll actually look at.
Why it's worth the effort
Marketing is a big line in most budgets. Gartner's 2025 CMO Spend Survey of 402 marketing leaders found budgets flat at 7.7% of company revenue, with 59% saying they didn't have enough budget to carry out their strategy.
7.7%
of company revenue goes to marketing, unchanged from 2024
Gartner CMO Spend Survey 2025
59%
of marketing leaders say their budget isn't enough for their strategy
Gartner CMO Spend Survey 2025
30.6%
of marketing budgets is spent on paid media
Gartner CMO Spend Survey 2025
When money is tight, the businesses that know which channels pay back can move budget towards them. Everyone else is guessing.
The ROI formula, kept simple
Marketing ROI compares what a channel earned with what it cost:
ROI = (gross profit from the channel − cost of the channel) ÷ cost of the channel
We use gross profit rather than revenue, because a $1,000 sale that costs you $600 to deliver didn't earn $1,000. If you only have revenue, you're measuring return on ad spend (ROAS), which is useful but flatters every channel.
GA4's job is the middle part: telling you which channel each enquiry or sale came from. Here's how the data flows.
From click to ROI
- 01
Tagged link
Every campaign link carries UTM tags, so GA4 knows the source.
- 02
Visit
GA4 records the session and which channel it came from.
- 03
Key event
A form, call or purchase is recorded as a key event, with a value.
- 04
Costs
Ad spend is imported or added, channel by channel.
- 05
Dashboard
Value, cost and ROI per channel, in one place, every month.
How to measure marketing ROI with GA4, step by step
- 1
Decide what counts as a result
For most service businesses that's a contact form sent, a quote requested, a phone number tapped or a booking made. For a shop, it's a purchase. Write the list down: three to five actions, no more.
- 2
Track them as key events
In March 2024 Google renamed conversions in GA4 to 'key events'. Make sure each action on your list fires an event (a developer or Google Tag Manager can add any that are missing), then mark it as a key event in GA4's Admin settings.
- 3
Give each result a value
Purchases carry their own value. For leads, estimate one: if a quarter of enquiries become clients worth $2,000 each, an enquiry is worth about $500. Send that value with the key event, so GA4 reports money, not just counts.
- 4
Tag every campaign link
Add utm_source, utm_medium and utm_campaign to every link in ads, emails and social posts. Untagged links are lumped into 'direct' or 'referral', and your best campaign can vanish into the noise. Agree one naming style (all lowercase, for example) and stick to it.
- 5
Bring in your costs
Linking Google Ads to GA4 imports its costs automatically. For other channels, such as Meta ads, an SEO retainer or a newsletter tool, use GA4's cost data import or simply add the monthly figure in your dashboard.
- 6
Close the loop with your CRM
GA4 knows who enquired, not who became a client. Capture the UTM source in hidden form fields and save it in your CRM with each lead. Then you can see real revenue by channel, not just estimated lead values.
A worked example
Here's what this looks like for a fictional service business with an average job worth $1,200 at a 50% gross margin. The numbers are illustrative, but the pattern is one you'll often see.
| Channel | Monthly cost | Leads | New clients | Gross profit | ROI |
|---|---|---|---|---|---|
| Google Ads | $1,500 | 30 | 6 | $3,600 | 140% |
| SEO | $1,000 | 25 | 5 | $3,000 | 200% |
| Facebook ads | $800 | 40 | 2 | $1,200 | 50% |
| Email newsletter | $150 | 8 | 3 | $1,800 | 1,100% |
Look at Facebook. It brings in the most leads, so on a leads-only report it looks like the star. But few of those leads become clients, and on profit it's the weakest channel. That's exactly why counting enquiries isn't enough.
Cost to win one new client, by channel
The email newsletter looks spectacular, but it only works on people who already know you. It can't replace the channels that find new customers. ROI tells you where to look closer, not what to switch off.

Build a dashboard people will use
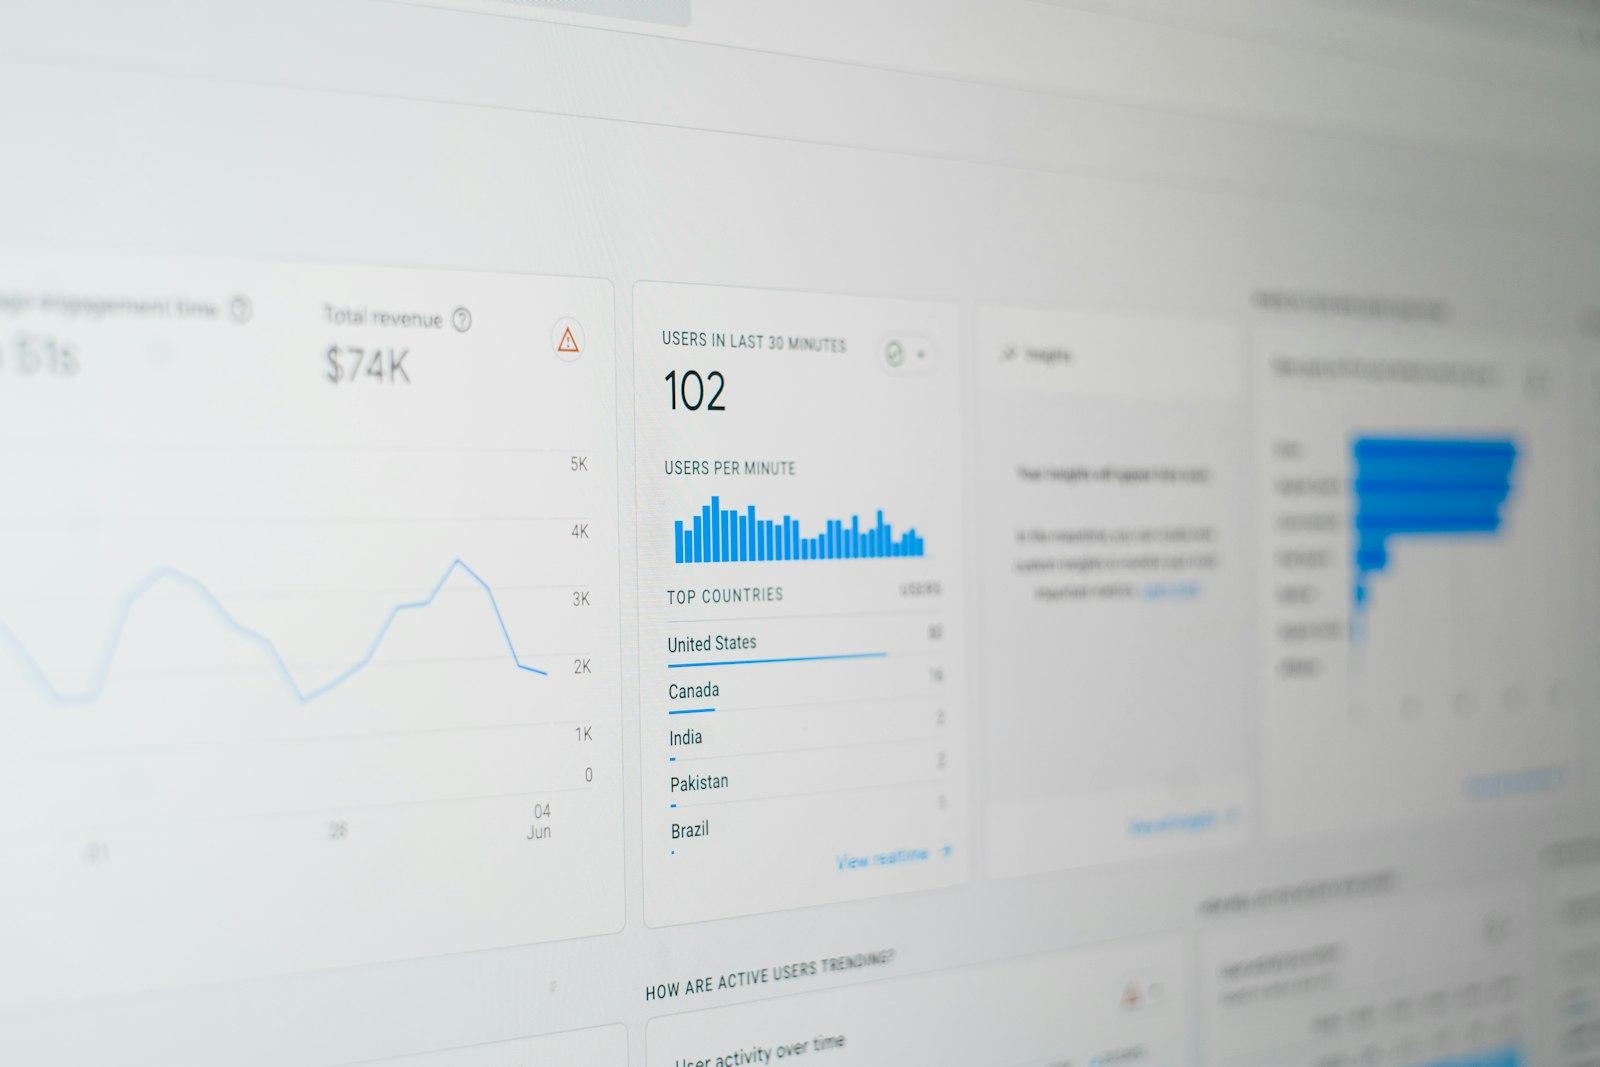
GA4's built-in reports are powerful but busy. For a monthly view, we prefer a simple dashboard in Looker Studio, Google's free reporting tool, which connects straight to GA4 and can pull in a spreadsheet of costs.
Keep it to one screen:
- Top row: total marketing spend, total value of key events, and overall ROI for the month.
- Middle: a table by channel showing cost, key events, value and ROI, like the example above.
- Bottom: a trend line of key events over the last 12 months, so you can see seasonality.
That's it. If a number on the dashboard wouldn't change a decision, take it off. Set it to email itself to the team on the first Monday of the month; our post on workflow automation ideas covers that kind of reporting win.
A good marketing dashboard answers one question: where should next month's money go?
Common mistakes we see
- Counting page views or clicks as results. They're signs of interest, not outcomes. Only key events tied to money belong in an ROI report.
- Forgetting phone calls. For many local businesses, most enquiries are calls. Track taps on your phone number as a key event, and consider call tracking for ads.
- Inconsistent UTM tags. "Facebook", "facebook" and "fb" show up as three different sources. Keep a shared naming sheet.
- Judging too soon. SEO and content take months to pay back; paid ads pay back faster but stop when the spend stops. Compare channels over a quarter, not a week.
- Tracking the form, not the reply. If enquiries aren't answered quickly, every channel looks worse than it is. Our guide to conversion rate optimization covers the leaks between click and client.
If your enquiries come mostly from nearby customers, our local SEO guide shows how to grow the channel that often has the best long-term ROI. And if your leads live in spreadsheets, it may be time to look at a CRM that fits how you work.
Force Media sets up analytics, tracking and marketing dashboards for businesses in Sri Lanka, Australia and beyond, so you can see which campaigns pay for themselves. Ask us for a tracking review, and we'll show you what your current setup is missing.